Uncovering Trends and the Impact of Water Access
Explore the intricacies of ISO/PPC Class scores and their impact on communities. Our analysis of the national average reveals a symmetrical bell curve with a notable spike in Class 9 ratings. The pivotal role of water access in determining these scores becomes evident, especially for communities striving to surpass an 8B rating. This exploration sheds light on the nuances of score distribution.
National Averages, Class 9 Anomalies, and the Role of Water Access
We thought it would be interesting to get a baseline for an average ISO / PPC Class score. We reviewed the national average published by ISO.
While we identified a few trends, it’s hard to make broad assumptions about the data. We initially broke the class ratings down into three buckets to make it easier: 3 or below, 4-8, and 8B-10.
The distribution is below.
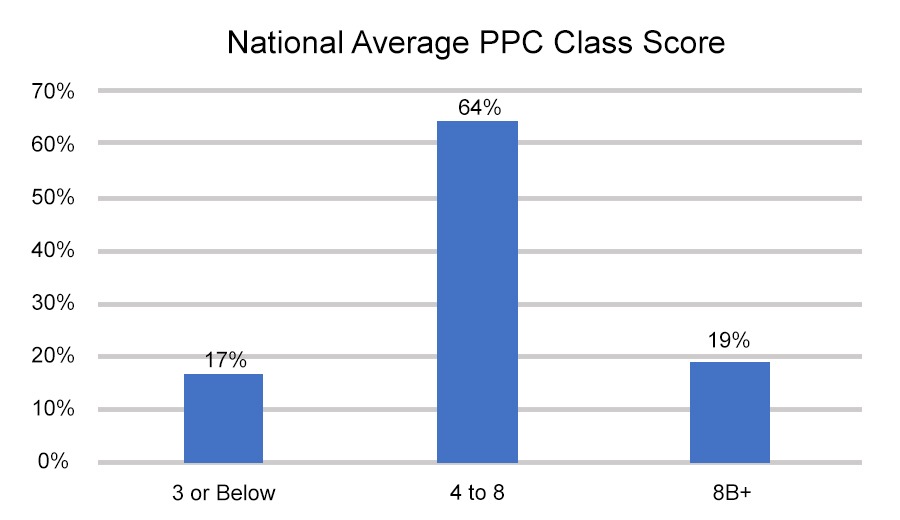
Unsurprisingly, the data formed a symmetrical bell curve. The national average is around 5.5. However, when we broke out the individual scores, we noticed an unusual spike at the far-right end of the curve. There are a lot of departments with a Class 9 rating.
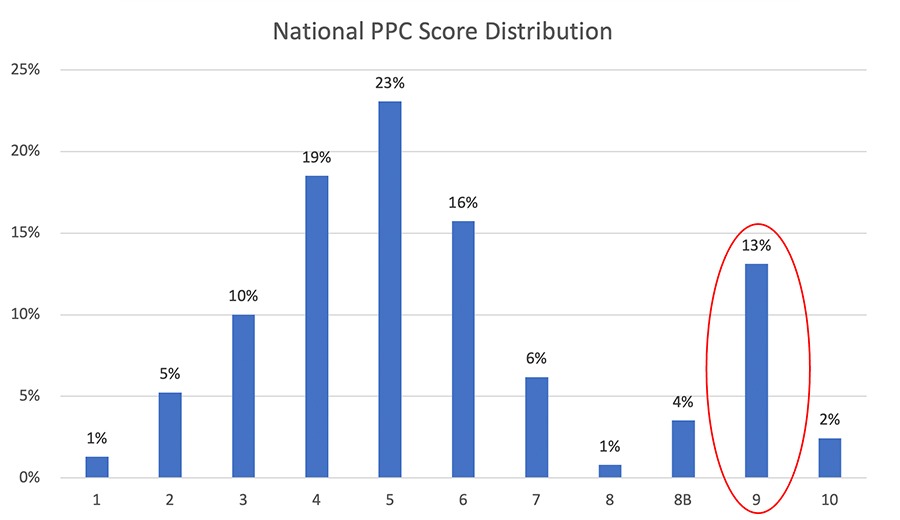
Unlike the left end of the curve, which follows a stair-step approach to the average, the right end of the curve shows an unusually large concentration of customers with a score of 9.
We looked at the criteria to receive a score of 8B or better. It comes down to access to water.
Our understanding is that certain communities cannot advance beyond an 8B without enhancing their access to water. 8B recognizes departments that attempt to mitigate the lack of access.